

Question: Table 1.19 shows the total US labor force, L. Find the average rate of change between 1940 and 2000; between 1940 and 1960; between 1980
Table 1.19 shows the total US labor force, L. Find the average rate of change between 1940 and 2000; between 1940 and 1960; between 1980 and 2000. Give units and interpret your answers in terms of the labor force.
Table 1.19 US labor force, in thousands of workers
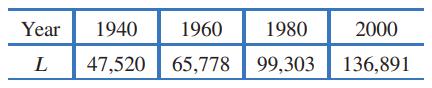
Year 1940 1960 1980 2000 L 47,520 65,778 99,303 136,891
Step by Step Solution
★★★★★
3.41 Rating (154 Votes )
There are 3 Steps involved in it
1 Expert Approved Answer
Step: 1 Unlock

Between 1940 and 2000 This means that between 1940 and 2000 the labor force increased by an ... View full answer
Question Has Been Solved by an Expert!
Get step-by-step solutions from verified subject matter experts
Step: 2 Unlock
Step: 3 Unlock