

The approximate percentage of people, P, below the poverty level in the US is given in Table
Question:
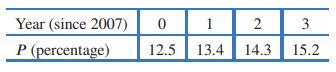
The approximate percentage of people, P, below the poverty level in the US is given in Table 1.6.
(a) Find a formula for the percentage in poverty as a linear function of time in years since 2007.
(b) Use the formula to predict the percentage in poverty in 2013.
(c) What is the difference between the prediction and the actual percentage, 14.5%?
Table 1.6
Fantastic news! We've Found the answer you've been seeking!
Step by Step Answer:
a A linear function has the form P b mt where t is in years since 2007 ...View the full answer

Answered By
Somshukla Chakraborty
I have a teaching experience of more than 4 years by now in diverse subjects like History,Geography,Political Science,Sociology,Business Enterprise,Economics,Environmental Management etc.I teach students from classes 9-12 and undergraduate students.I boards I handle are IB,IGCSE, state boards,ICSE, CBSE.I am passionate about teaching.Full satisfaction of the students is my main goal.
I have completed my graduation and master's in history from Jadavpur University Kolkata,India in 2012 and I have completed my B.Ed from the same University in 2013. I have taught in a reputed school of Kolkata (subjects-History,Geography,Civics,Political Science) from 2014-2016.I worked as a guest lecturer of history in a college of Kolkata for 2 years teaching students of 1st ,2nd and 3rd year. I taught Ancient and Modern Indian history there.I have taught in another school in Mohali,Punjab teaching students from classes 9-12.Presently I am working as an online tutor with concept tutors,Bangalore,India(Carve Niche Pvt.Ltd.) for the last 1year and also have been appointed as an online history tutor by Course Hero(California,U.S) and Vidyalai.com(Chennai,India).
2+ Reviews
10+ Question Solved
Related Book For 

Applied Calculus
ISBN: 9781119275565
6th Edition
Authors: Deborah Hughes Hallett, Patti Frazer Lock, Andrew M. Gleason, Daniel E. Flath, Sheldon P. Gordon, David O. Lomen, David Lovelock, William G. McCallum, Brad G. Osgood, Andrew Pasquale
Question Posted:
