

Figure 1.64 shows supply and demand for a product. (a) What is the equilibrium price for this
Question:
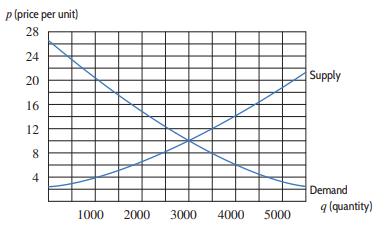
Figure 1.64 shows supply and demand for a product.
(a) What is the equilibrium price for this product? At this price, what quantity is produced?
(b) Choose a price above the equilibrium price—for example, p = 12. At this price, how many items are suppliers willing to produce? How many items do consumers want to buy? Use your answers to these questions to explain why, if prices are above the equilibrium price, the market tends to push prices lower (toward the equilibrium).
(c) Now choose a price below the equilibrium price— for example, p = 8. At this price, how many items are suppliers willing to produce? How many items do consumers want to buy? Use your answers to these questions to explain why, if prices are below the equilibrium price, the market tends to push prices higher (toward the equilibrium).
Figure 1.64
Step by Step Answer:
a We know that the equilibrium point is the point where the supply and demand curves intersect Looki...View the full answer


Applied Calculus
ISBN: 9781119275565
6th Edition
Authors: Deborah Hughes Hallett, Patti Frazer Lock, Andrew M. Gleason, Daniel E. Flath, Sheldon P. Gordon, David O. Lomen, David Lovelock, William G. McCallum, Brad G. Osgood, Andrew Pasquale
