

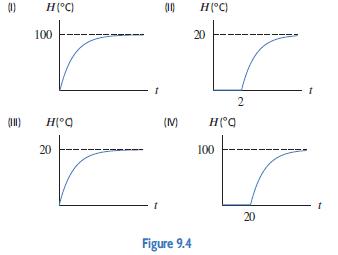
Question: The graphs in Figure 9.4 represent the temperature, H(C), of four eggs as a function of time, t, in minutes. Match three of the graphs
The graphs in Figure 9.4 represent the temperature, H(◦C), of four eggs as a function of time, t, in minutes. Match three of the graphs with the descriptions (a)–(c). Write a similar description for the fourth graph, including an interpretation of any intercepts and asymptotes.
(a) An egg is taken out of the refrigerator (just above 0◦C) and put into boiling water.
(b) Twenty minutes after the egg in part (a) is taken out of the fridge and put into boiling water, the same thing is done with another egg.
(c) An egg is taken out of the refrigerator at the same time as the egg in part (a) and left to sit on the kitchen table.
(1) (1) H(C) 100 H(C) 20 (10) (M) Figure 9.4 H(C) 20 H(Q 100 2 20 1 t
Step by Step Solution
3.34 Rating (160 Votes )
There are 3 Steps involved in it
a I b IV c III Graph II repre... View full answer

Get step-by-step solutions from verified subject matter experts