

Question: There are two kinds of dose-response curves. One type, discussed in this section, plots the intensity of response against the dose of the drug. We
There are two kinds of dose-response curves. One type, discussed in this section, plots the intensity of response against the dose of the drug. We now consider a dose-response curve in which the percentage of subjects showing a specific response is plotted against the dose of the drug. In Problems the curve on the left shows the percentage of subjects exhibiting the desired response at the given dose, and the curve on the right shows the percentage of subjects for which the given dose is lethal.
In Figure 4.83, what range of doses appears to be both safe and effective for 99% of all patients?
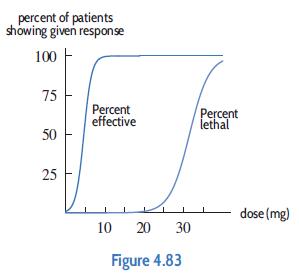
percent of patients showing given response 100 75 50 25 Percent effective 10 20 30 Figure 4.83 Percent lethal dose (mg)
Step by Step Solution
3.50 Rating (157 Votes )
There are 3 Steps involved in it
The range of safe and effective dose... View full answer

Get step-by-step solutions from verified subject matter experts