

Question: Using Table 8.4, graph heat index as a function of humidity with temperature fixed at 70F and at 100F. Explain the features of each graph
Using Table 8.4, graph heat index as a function of humidity with temperature fixed at 70◦F and at 100◦F. Explain the features of each graph and the difference between them in common-sense terms.
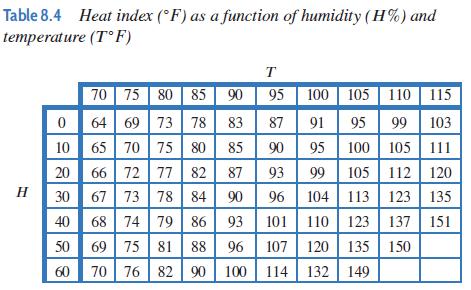
Table 8.4 Heat index (F) as a function of humidity (H%) and temperature (F) H 70 75 80 85 90 0 64 69 73 78 10 65 70 75 80 20 66 72 77 82 73 78 84 30 67 40 68 74 79 86 50 69 75 81 88 96 60 70 76 82 90 100 88988 8888 83 85 87 90 93 T 95 100 105 110 115 87 91 95 99 103 100 105 90 95 111 93 99 105 112 120 96 104 104 113 123 135 101 110 123 137 151 107 120 135 150 114 132 149
Step by Step Solution
3.48 Rating (161 Votes )
There are 3 Steps involved in it
Both graphs are increasing because at any fixed temperature the air feels hotter as th... View full answer

Get step-by-step solutions from verified subject matter experts