

Question: A study records the overall preference for a product (How would you rate this product?) and attitudes towards the price of a product (It is
A study records the overall preference for a product (“How would you rate this product?”) and attitudes towards the price of a product (“It is a fair price”). The result is the crosstab in Fig. 9.51.
Figure 9.51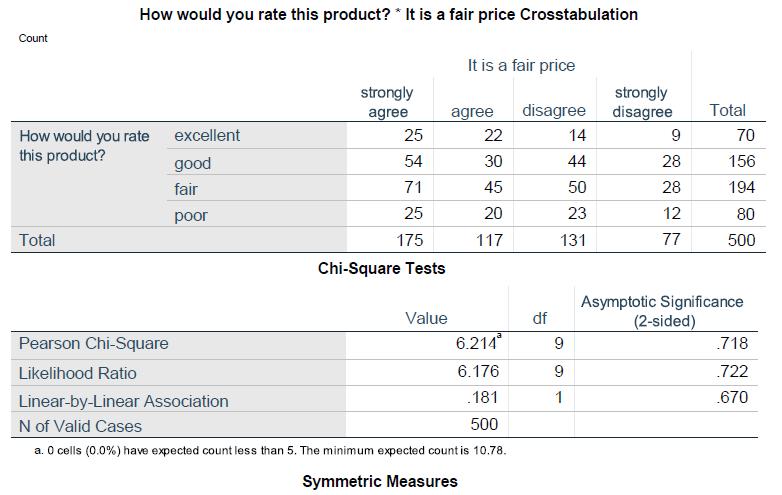
(a) What per cent of respondents who rated the product as poor strongly disagree with the statement “It is a fair price”?
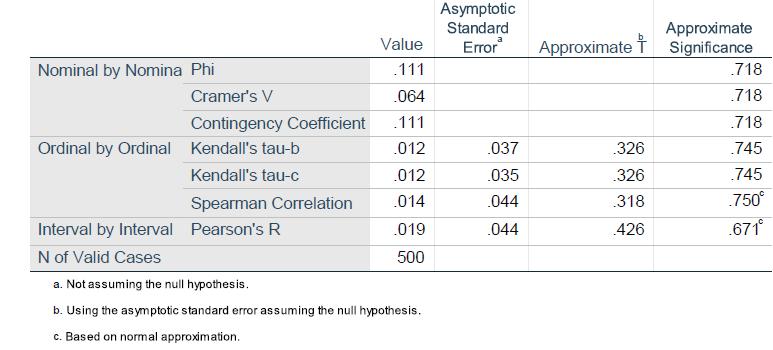
(b) Is the relationship significant? To answer this question, assess the coefficients Phi, Cramer’s V, Contingency Coefficient, and Kendall’s Tau.
(c) After a product presentation, the same subjects are asked about their attitude to the price of the product (“After product presentation: It is a fair price”) on a scale from one (“strongly agree”) to four (“strongly disagree”). Their responses are then subject to a statistical test. Interpret the results from Fig. 9.52.
Figure 9.52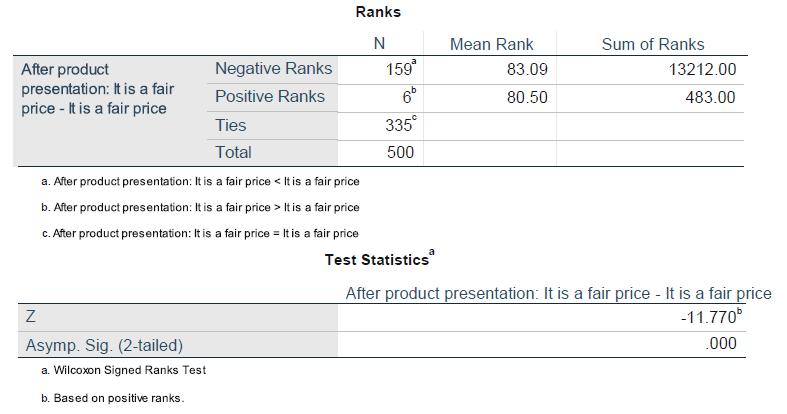
(d) Their responses are now tested again but this time using a different procedure.
Interpret the results in Fig. 9.53. Is there a nonparametric way to analyse the change in preferences here?
Figure 9.53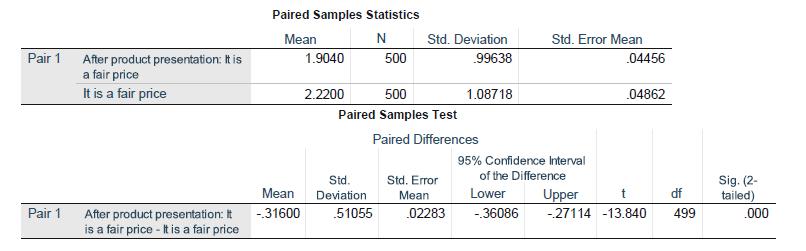
Count How would you rate this product? * It is a fair price Crosstabulation How would you rate excellent this product? Total Pearson Chi-Square Likelihood Ratio good fair poor strongly agree 25 54 71 25 175 Chi-Square Tests Value It is a fair price agree 22 30 45 20 117 6.214 6.176 Linear-by-Linear Association .181 N of Valid Cases 500 a. 0 cells (0.0%) have expected countless than 5. The minimum expected count is 10.78. Symmetric Measures disagree 14 44 50 23 131 df 9 9 1 strongly disagree 9 28 28 12 77 Total (2-sided) 70 156 194 80 500 Asymptotic Significance 718 .722 .670
Step by Step Solution
3.42 Rating (158 Votes )
There are 3 Steps involved in it
a The percentage is p 1280 15 b This case involves two ordinal scale variables each capable of havin... View full answer

Get step-by-step solutions from verified subject matter experts