

A article in the Journal of Quality in Clinical Practice [The Application of Statistical Process Control Charts
Question:
(a) What distribution might be expected for these data? What type of control chart might be appropriate?
(b) Construct the chart you selected in part (a).
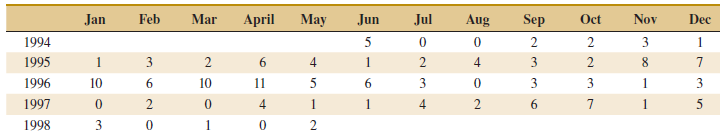
(c) Construct a CUSUM chart for these data with k = 0.5 and h = 4. The article included a similarly construced CUSUM chart. What is assumed for the distribution of the data in this chart? Can your CUSUM chart perform adequately?
(d) Repeat part (c) for an EWMA chart with λ = 0.2.
DistributionThe word "distribution" has several meanings in the financial world, most of them pertaining to the payment of assets from a fund, account, or individual security to an investor or beneficiary. Retirement account distributions are among the most...
Fantastic news! We've Found the answer you've been seeking!
Step by Step Answer:
a A Poisson distribution is expected and a C chart might ...View the full answer

Answered By
Stephen ouma
I have worked with different academic writing companies such as wriredom, writerbay, and Upwork. While working with these companies, I have helped thousands of students achieve their academic dreams. This is what I also intend to do here in SolutionInn
19+ Reviews
63+ Question Solved
Related Book For 

Applied Statistics And Probability For Engineers
ISBN: 9781118539712
6th Edition
Authors: Douglas C. Montgomery, George C. Runger
Question Posted:
