

Question: A paper in Quality Engineering [2013, Vol. 25(1)] presented data on cycles to failure of solder joints at different temperatures for different types of printed
(a) Test the null hypothesis at α = 0.05 that the cycles to failure are the same at both temperatures. Is the alternative one or two sided?
(b) Find a 95% confidence interval for the difference in the mean cycles to failure for the two temperatures.
(c) Is the value zero contained in the 95% confidence interval? Explain the connection with the conclusion you reached in part (a).
(d) Do normal probability plots of part cycles to failure indicate any violations of the assumptions for the tests and confidence interval that you performed?
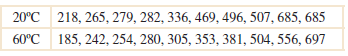
20C 218, 265, 279, 282, 336, 469, 496, 507, 685, 685 60C 185, 242, 254, 280, 305, 353, 381, 504, 556, 697
Step by Step Solution
3.56 Rating (174 Votes )
There are 3 Steps involved in it
a 1 The parameter of interest is the difference in mean cycles to failure 1 2 with 0 0 2 H 0 1 2 ... View full answer

Get step-by-step solutions from verified subject matter experts