

An article in Quality & Safety in Health Care [Statistical Process Control as a Tool for Research
Question:
The following tables show approximate data for the average daily waste per month before and after process changes, respectively. The process change included an education campaign to provide an operational definition for infectious waste.
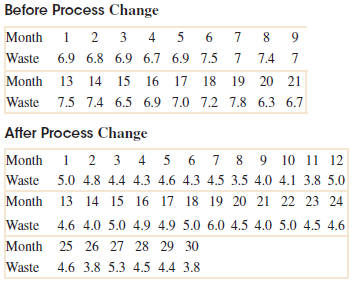
(a) Handle the data before and after the process change separately and construct individuals and moving-range charts for each set of data. Assume that assignable causes can be found and eliminate suspect observations. If necessary, revise the control limits.
(b) Comment on the control of each chart and differences between the charts. Was the process change effective?
Fantastic news! We've Found the answer you've been seeking!
Step by Step Answer:
a For data before the process change point 20 on the moving range chart is more than 3 standard devi...View the full answer

Answered By
Branice Buyengo Ajevi
I have been teaching for the last 5 years which has strengthened my interaction with students of different level.
1+ Reviews
10+ Question Solved
Related Book For 

Applied Statistics And Probability For Engineers
ISBN: 9781118539712
6th Edition
Authors: Douglas C. Montgomery, George C. Runger
Question Posted:
