

Question: An article in Quality Engineering [Estimating Sources of Variation: A Case Study from Polyurethane Product Research (19992000, Vol.)] reported a study on the effects of
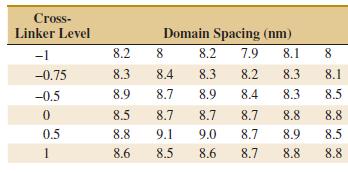
An article in Quality Engineering [€œEstimating Sources of Variation: A Case Study from Polyurethane Product Research€ (1999€“2000, Vol.)] reported a study on the effects of additives on final polymer properties. In this case, polyurethane additives were referred to as cross-linkers. The average domain spacing was the measurement of the polymer property. The data are as follows:
(a) Is there a difference in the cross-linker level? Draw comparative box plots and perform an analysis of variance. Use α = 0.05.
(b) Find the P-value of the test. Estimate the variability due to random error.
(c) Plot average domain spacing against cross-linker level and interpret the results.
(d) Analyze the residuals from this experiment and comment on model adequacy.
Cross- Linker Level Domain Spacing (nm) -1 8.2 8 8.2 7.9 8.1 8 -0.75 8.3 8.4 8.3 8.2 8.3 8.1 -0.5 8.9 8.7 8.9 8.4 8.3 8.5 8.5 8.7 8.7 8.7 8.8 8.8 0.5 8.8 9.1 9.0 8.7 8.9 8.5 1 8.6 8.5 8.6 8.7 8.8 8.8
Step by Step Solution
3.40 Rating (162 Votes )
There are 3 Steps involved in it
a Anova Yes the box plot and ANOVA show that there is a ... View full answer

Get step-by-step solutions from verified subject matter experts