

Question: An article in the Journal of Materials Processing Technology (1997, Vol. 67, pp. 5561) used response surface methodology to generate surface roughness prediction models for
An article in the Journal of Materials Processing Technology (1997, Vol. 67, pp. 55€“61) used response surface methodology to generate surface roughness prediction models for turning EN 24T steel (290 BHN). The data are shown in the following table.
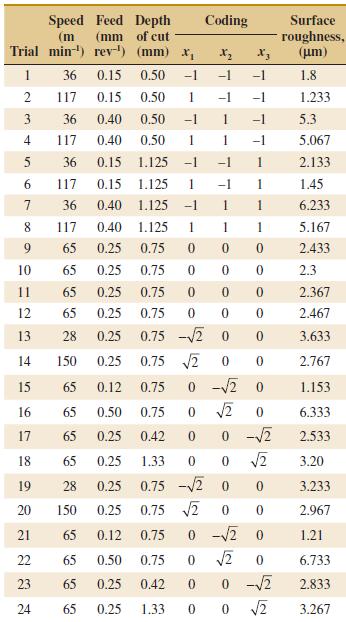
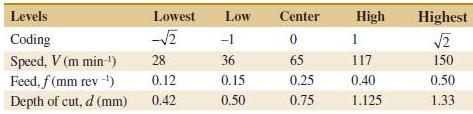
The factors and levels for the experiment are shown in Table E14-3.
(a) Plot the points at which the experimental runs were made.
(b) Fit both first-and second-order models to the data. Comment on the adequacies of these models.
(c) Plot the roughness response surface for the second-order model and comment.
Coding Speed Feed Depth (mm of cut Trial min-') rev-') (mm) x, Surface roughness, (um) (m 36 0.15 0.50 -1 -1 -1 1.8 117 0.15 0.50 1 -1 1.233 -1 -1 -1 36 0.40 0.50 5.3 5.067 4. 117 0.40 0.50 1 1 -1 0.15 1.125 -1 36 -1 1 2.133 1.45 117 0.15 1.125 -1 36 0.40 1.125 -1 1 1 6.233 8. 117 0.40 1.125 1 1 5.167 2.433 9. 65 0.25 0.75 10 65 0.25 0.75 2.3 2.367 11 65 0.25 0.75 0.25 12 65 0.75 2.467 0.75 -2 0 3.633 13 28 0.25 0.75 2 14 150 0.25 2.767 15 65 0.12 0.75 1.153 16 65 0.50 0.75 6.333 17 65 0.25 0.42 2.533 1.33 18 65 0.25 3.20 0.25 0.75 -V2 0.25 0.75 V2 3.233 19 28 20 150 2.967 21 65 0.12 0.75 1.21 0.75 22 65 0.50 6.733 23 65 0.25 0.42 2.833 24 65 0.25 1.33 3.267
Step by Step Solution
3.33 Rating (165 Votes )
There are 3 Steps involved in it
a A plot of the coded data follows b Computer results are shown below for the firstorder and secondo... View full answer

Get step-by-step solutions from verified subject matter experts