

An article in the Journal of the American Statistical Association [Markov Chain Monte Carlo Methods for Computing
Question:
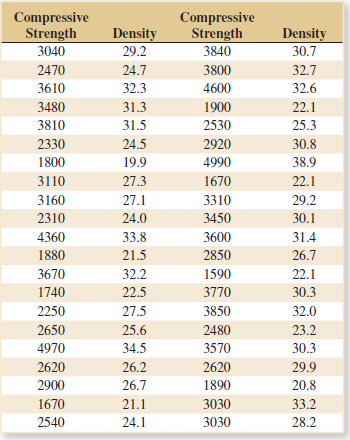
(a) Fit a regression model relating compressive strength to density.
(b) Test for significance of regression with α = 0.05.
(c) Estimate σ2 for this model.
(d) Calculate R2 for this model. Provide an interpretation of this quantity.
(e) Prepare a normal probability plot of the residuals and interpret this display.
(f) Plot the residuals versus y and versus x. Does the assumption of constant variance seem to be satisfied?
TABLE 11-5 Strength Data
Fantastic news! We've Found the answer you've been seeking!
Step by Step Answer:
a The regression equation is Compressive Strength 2150 185 Density Analysis of Variance b ...View the full answer

Answered By
Hamza Amjad
Currently I am student in master degree program.from last two year I am tutring in Academy and I tought many O/A level student in home tution.
3+ Reviews
10+ Question Solved
Related Book For 

Applied Statistics And Probability For Engineers
ISBN: 9781118539712
6th Edition
Authors: Douglas C. Montgomery, George C. Runger
Question Posted:
