

Consider the data on the number of earthquakes of magnitude 7.0 or greater by year in Exercise
Question:
(a) Construct a U chart for this data with a sample size of n = 1.
(b) Do the data appear to be generated by an in-control process? Explain.
Exercise 6-87
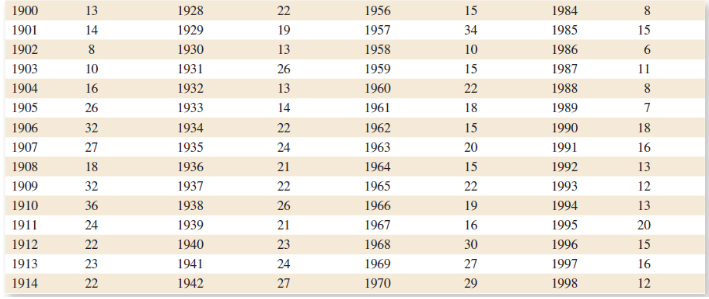
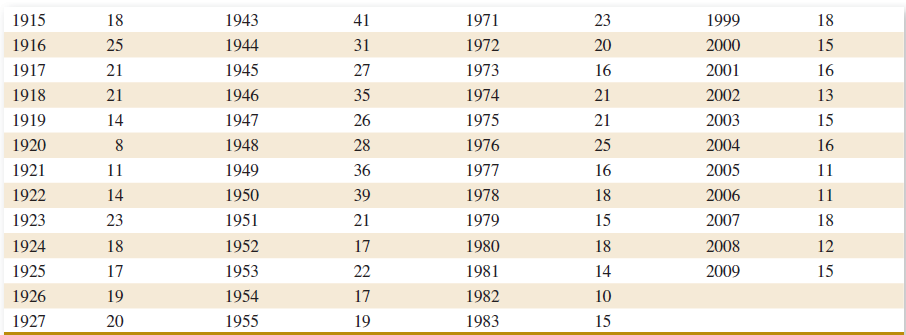
Table 6E.3 shows the number of earthquakes per year of magnitude 7.0 and higher since 1900 (source: Earthquake Data Base System of the U.S. Geological Survey, National Earthquake Information Center, Golden, Colorado). Construct and interpret either a digidot plot or a separate stemand-leaf and time series plot of these data.
Table 6E.3
Fantastic news! We've Found the answer you've been seeking!
Step by Step Answer:
a b No The process is outofcontrol at observations 11 44 47 50 51 58 ...View the full answer

Answered By
Sumit kumar
I am an experienced online essay writer with a thorough understanding of any curriculum.and subject expert at Chegg for mathematics, CS subjects..
5+ Reviews
13+ Question Solved
Related Book For 

Applied Statistics And Probability For Engineers
ISBN: 9781118539712
6th Edition
Authors: Douglas C. Montgomery, George C. Runger
Question Posted:
