

Consider the regression model fit to the arsenic data in Exercise 12-16. Use arsenic in nails as
Question:
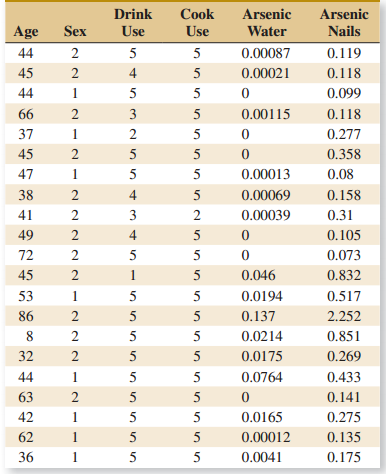
(a) What proportion of total variability is explained by this model?
(b) Construct a normal probability plot of the residuals. What conclusion can you draw from this plot?
(c) Plot the residuals versus y and versus each regressor, and comment on model adequacy.
(d) Calculate Cook€™s distance for the observations in this data set. Are there any influential points in these data?
Fantastic news! We've Found the answer you've been seeking!
Step by Step Answer:
a R 2 81 b Assumption of normality is not adequate c The graphs indicate nonconstant varian...View the full answer

Answered By
Nick Mawira
I am a detailed and thorough professional with 4 years of administrative experience- the last two in academic writing and virtual office environment. I specialize in delivering quality services with respect to strict deadlines and high expectations. I am equipped with a dedicated office complete with computers, copier/scanner/fax and color printer.
Additionally, I provide creative and detailed administrative, web search, academic writing, data entry, Personal assistant, Content writing, Translation, Academic writing, editing and proofreading services. I excel at working under tight deadlines with strict expectations. More so, I possess the self-discipline and time management skills necessary to deliver quality work.
0 Reviews
10+ Question Solved
Related Book For 

Applied Statistics And Probability For Engineers
ISBN: 9781118539712
6th Edition
Authors: Douglas C. Montgomery, George C. Runger
Question Posted:
