

Question: Consider the regression model fit to the coal and limestone mixture data in Exercise 12-17. Use density as the response. (a) What proportion of total
Consider the regression model fit to the coal and limestone mixture data in Exercise 12-17. Use density as the response.
(a) What proportion of total variability is explained by this model?
(b) Construct a normal probability plot of the residuals. What conclusion can you draw from this plot?
(c) Plot the residuals versus y and versus each regressor, and comment on model adequacy.
(d) Calculate Cook€™s distance for the observations in this data set. Are there any influential points in these data?
Exercise 12-17
An article in IEEE Transactions on Instrumentation and Measurement (2001, Vol. 50, pp. 2033€“2040) reported on a study that had analyzed powdered mixtures of coal and limestone for permittivity. The errors in the density measurement was the response. The data are reported in Table E12-9.
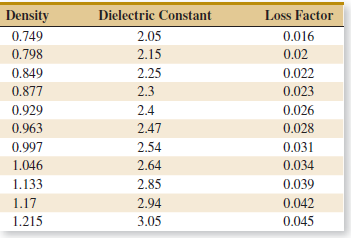
Density Dielectric Constant Loss Factor 0.749 2.05 0.016 0.798 2.15 0.02 0.849 2.25 0.022 0.877 2.3 0.023 0.026 0.929 2.4 0.963 2.47 0.028 0.997 1.046 2.54 0.031 2.64 0.034 1.133 2.85 0.039 1.17 2.94 0.042 0.045 1.215 3.05
Step by Step Solution
3.38 Rating (160 Votes )
There are 3 Steps involved in it
a R 2 997 b Assumption of normality appears adequate c There is a nonconst... View full answer

Get step-by-step solutions from verified subject matter experts