

Question: Construct a normal probability plot of the octane rating data in Exercise 6-30. Does it seem reasonable to assume that octane rating is normally distributed?
Data from 6-30
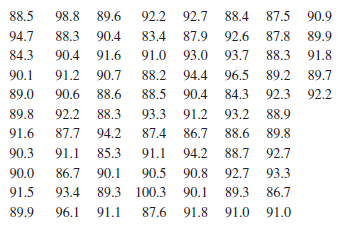
88.5 98.8 89.6 92.2 92.7 88.4 87.5 90.9 88.3 90.4 94.7 83.4 87.9 92.6 87.8 89.9 84.3 90.4 91.6 91.0 93.0 93.7 88.3 91.8 90.1 91.2 90.7 88.2 94.4 96.5 89.2 89.7 88.5 90.4 92.2 89.0 90.6 88.6 84.3 92.3 89.8 92.2 88.3 93.3 91.2 93.2 88.9 91.6 87.7 94.2 87.4 86.7 88.6 89.8 90.3 91.1 85.3 91.1 94.2 88.7 92.7 90.0 86.7 90.1 90.5 90.8 92.7 93.3 91.5 93.4 89.3 100.3 90.1 89.3 86.7 89.9 96.1 91.1 87.6 91.8 91.0 91.0
Step by Step Solution
★★★★★
3.42 Rating (158 Votes )
There are 3 Steps involved in it
1 Expert Approved Answer
Step: 1 Unlock

The data appear to be approximately normally distributed How... View full answer
Question Has Been Solved by an Expert!
Get step-by-step solutions from verified subject matter experts
Step: 2 Unlock
Step: 3 Unlock