

Question: In their book Time Series Analysis, Forecasting, and Control (Prentice Hall, 1994), G. E. P. Box, G. M. Jenkins, and G. C. Reinsel present chemical
Construct and interpret either a digidot plot or a separate stemand - leaf and time series plot of these data.
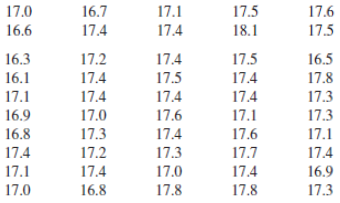
17.0 16.7 17.1 17.5 17.6 16.6 17.4 17.4 18.1 17.5 17.4 16.3 17.2 17.5 16.5 17.5 17.8 16.1 17.4 17.4 17.4 17.4 17.3 17.1 17.4 17.1 16.9 17.0 17.6 17.3 16.8 17.3 17.1 17.4 17.3 17.6 17.7 17.4 17.4 17.2 17.4 17.1 17.0 17.4 17.0 16.9 16.8 17.8 17.8 17.3
Step by Step Solution
★★★★★
3.42 Rating (165 Votes )
There are 3 Steps involved in it
1 Expert Approved Answer
Step: 1 Unlock

Stemandleaf of Chem Concentration N 50 Leaf Unit 010 In the time ... View full answer
Question Has Been Solved by an Expert!
Get step-by-step solutions from verified subject matter experts
Step: 2 Unlock
Step: 3 Unlock