

Question: The pull-off force for a connector is measured in a laboratory test. Data for 40 test specimens follow (read down, then left to right). Construct
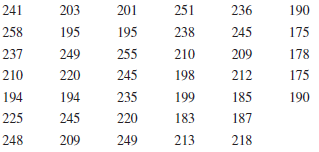
241 203 201 251 236 190 258 195 195 238 245 175 237 249 255 210 209 178 210 220 245 198 212 175 194 194 235 199 185 190 225 245 220 183 187 248 209 249 213 218
Step by Step Solution
★★★★★
3.45 Rating (164 Votes )
There are 3 Steps involved in it
1 Expert Approved Answer
Step: 1 Unlock

Stemandleaf display for Force unit 1 12 represents 12 In ... View full answer
Question Has Been Solved by an Expert!
Get step-by-step solutions from verified subject matter experts
Step: 2 Unlock
Step: 3 Unlock