

Question: Reconsider the energy consumption data in Exercise 6-37. Construct a box plot of the data and write an interpretation of the plot. How does the
Data from 6-37
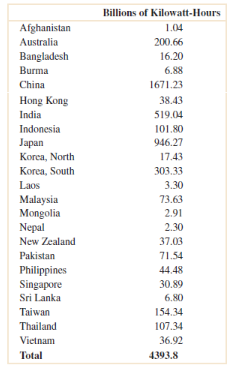
Billions of Kilowatt-Hours Afghanistan 1.04 Australia 200.66 Bangladesh Burma 16.20 6.88 China 1671.23 Hong Kong 38.43 519.04 India Indonesia 101.80 Japan 946.27 Korea, North 17.43 Korea, South 303.33 Laos 3.30 Malaysia Mongolia Nepal 73.63 2.91 2.30 New Zealand 37.03 Pakistan 71.54 Philippines Singapore Sri Lanka 44.48 30.89 6.80 Taiwan 154.34 Thailand 107.34 36.92 Vietnam Total 4393.8
Step by Step Solution
★★★★★
3.29 Rating (167 Votes )
There are 3 Steps involved in it
1 Expert Approved Answer
Step: 1 Unlock

The box plot shows the same basic information as the stem and lea... View full answer
Question Has Been Solved by an Expert!
Get step-by-step solutions from verified subject matter experts
Step: 2 Unlock
Step: 3 Unlock