

Question: Reconsider the semiconductor speed data in Exercise 6-42. Construct a box plot of the data and write an interpretation of the plot. How does the
Data from 6-42
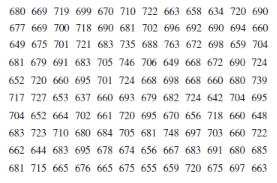
680 669 719 699 670 710 722 663 658 634 720 690 677 669 700 718 690 681 702 696 692 690 694 660 649 675 701 721 683 735 688 763 672 698 659 704 681 679 691 683 705 746 706 649 668 672 690 724 652 720 660 695 701 724 668 698 668 660 680 739 717 727 653 637 660 693 679 682 724 642 704 695 704 652 664 702 661 720 695 670 656 718 660 648 683 723 710 680 684 705 681 748 697 703 660 722 662 644 683 695 678 674 656 667 683 691 680 685 681 715 665 676 665 675 655 659 720 675 697 663
Step by Step Solution
3.51 Rating (164 Votes )
There are 3 Steps involved in it
The box plot shows that the data are symmetr... View full answer

Get step-by-step solutions from verified subject matter experts