

Question: Reconsider the weld strength data in Exercise 6-39. Construct a box plot of the data and write an interpretation of the plot. How does the
Data from 6-39
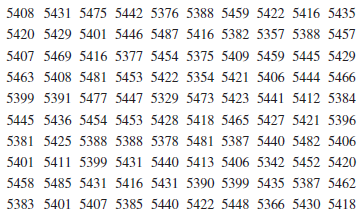
5408 5431 5475 5442 5376 5388 5459 5422 5416 5435 5420 5429 5401 5446 5487 5416 5382 5357 5388 5457 5407 5469 5416 5377 5454 5375 5409 5459 5445 5429 5463 5408 5481 5453 5422 5354 5421 5406 5444 5466 5399 5391 5477 5447 5329 5473 5423 5441 5412 5384 5445 5436 5454 5453 5428 5418 5465 5427 5421 5396 5381 5425 5388 5388 5378 5481 5387 5440 5482 5406 5401 5411 5399 5431 5440 5413 5406 5342 5452 5420 5458 5485 5431 5416 5431 5390 5399 5435 5387 5462 5383 5401 5407 5385 5440 5422 5448 5366 5430 5418
Step by Step Solution
3.33 Rating (165 Votes )
There are 3 Steps involved in it
This plot as the stem and leaf one indicat... View full answer

Get step-by-step solutions from verified subject matter experts