

Question: Reconsider the viscosity data in Exercise 15-22. Construct a CUSUM control chart for this process using μ 0 = 500 as the process target. Explain
Exercise 15-22
The viscosity of a chemical intermediate is measured every hour. Twenty samples each of size n = 1 are in the following table.
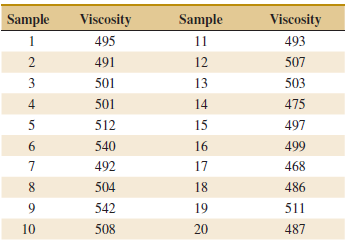
Viscosity Sample Sample Viscosity 495 1 11 493 12 2 491 507 3 501 13 503 4 501 14 475 512 15 497 6. 540 16 499 492 17 468 8. 504 18 486 542 19 511 10 508 20 487
Step by Step Solution
★★★★★
3.35 Rating (142 Votes )
There are 3 Steps involved in it
1 Expert Approved Answer
Step: 1 Unlock

Process standard deviation is estimated using the average moving ... View full answer
Question Has Been Solved by an Expert!
Get step-by-step solutions from verified subject matter experts
Step: 2 Unlock
Step: 3 Unlock