

Question: The following data were considered in Quality Progress [Digidot Plots for Process Surveillance (1990, May, pp. 6668)]. Measurements of center thickness (in mils) from 25
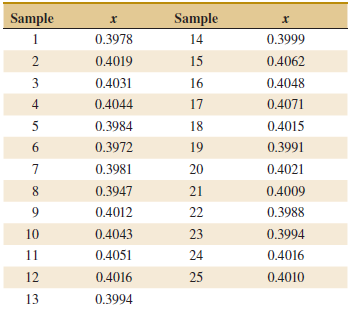
The following data were considered in Quality Progress [€œDigidot Plots for Process Surveillance€ (1990, May, pp. 66€“68)]. Measurements of center thickness (in mils) from 25 contact lenses sampled from the production process at regular intervals are shown in the following table.
(a) Construct a CUSUM scheme for this process with the target μ0 = 0.4. Explain how you determined your estimate of σ and the CUSUM parameters H and K. Is the process in control?
(b) Construct an EWMA control chart with λ= 0.5 and L = 3 and compare your conclusions to part (a).
Sample Sample 1 0.3978 14 0.3999 2 0.4019 15 0.4062 3 0.4031 16 0.4048 4. 0.4044 17 0.4071 0.3984 18 0.4015 6. 0.3972 19 0.3991 0.3981 20 0.4021 8. 0.3947 21 0.4009 0.4012 22 0.3988 10 0.4043 23 0.3994 11 0.4051 24 0.4016 12 0.4016 25 0.4010 13 0.3994
Step by Step Solution
3.44 Rating (160 Votes )
There are 3 Steps involved in it
a Here is estimated using the moving range 00026112800023 ... View full answer

Get step-by-step solutions from verified subject matter experts