

Question: Consider the (x, y) data in Table E11-10. Calculate the correlation coefficient. Graph the data and comment on the relationship between x and y. Explain
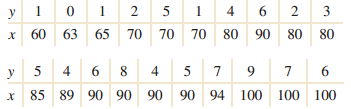
1 4 6 2 3 1 1 65 70 70 70 80 90 90 80 80 x 60 63 5 4 6 8 4 90 90 94 100 100 94 100 100 x 85 89 90 90
Step by Step Solution
★★★★★
3.34 Rating (172 Votes )
There are 3 Steps involved in it
1 Expert Approved Answer
Step: 1 Unlock

Here r 0 The correlation coefficient does ... View full answer
Question Has Been Solved by an Expert!
Get step-by-step solutions from verified subject matter experts
Step: 2 Unlock
Step: 3 Unlock