

Question: Table E11-21 shows the population and the average count of wood storks sighted per sample period for South Carolina from 1991 to 2004. Fit a
TABLE ˆ™ E11-20 Diamond Price Data
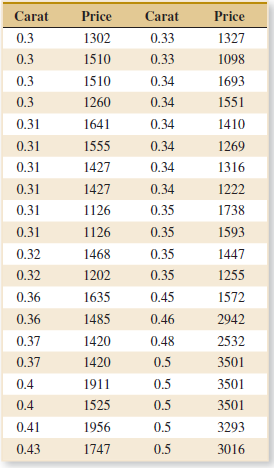
TABLE ˆ™ E11-21 Stork Population Data
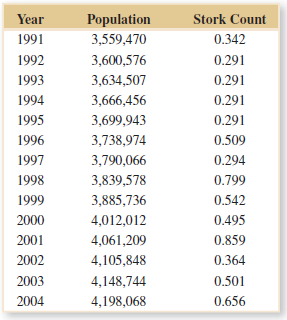
Carat Price Carat Price 1302 0.33 0.3 1327 0.3 1510 0.33 1098 0.3 1510 0.34 1693 0.3 1260 0.34 1551 0.31 1641 0.34 1410 1555 0.31 0.34 1269 0.31 1427 0.34 1316 1222 0.31 1427 0.34 0.31 1126 0.35 1738 1126 0.31 0.35 1593 0.32 1468 0.35 1447 1255 0.32 1202 0.35 1635 1572 0.36 0.45 2942 0.36 1485 0.46 1420 0.37 0.48 2532 0.5 1420 3501 0.37 0.4 1911 0.5 3501 1525 3501 0.4 0.5 3293 0.41 1956 0.5 0.5 0.43 1747 3016 Year Population Stork Count 1991 3,559,470 0.342 1992 3,600,576 0.291 1993 3,634,507 0.291 1994 3,666,456 0.291 1995 3,699,943 0.291 1996 3,738,974 0.509 1997 3,790,066 0.294 1998 3,839,578 0.799 1999 3,885,736 0.542 2000 4,012,012 0.495 2001 4,061,209 0.859 2002 4,105,848 0.364 2003 4,148,744 0.501 2004 4,198,068 0.656
Step by Step Solution
3.44 Rating (163 Votes )
There are 3 Steps involved in it
The regression equation is y 3549143 651828x Yes the regression is significant at ... View full answer

Get step-by-step solutions from verified subject matter experts