

The data in Table E11-20 related diamond carats to purchase prices. It appeared in Singapores Business Times,
Question:
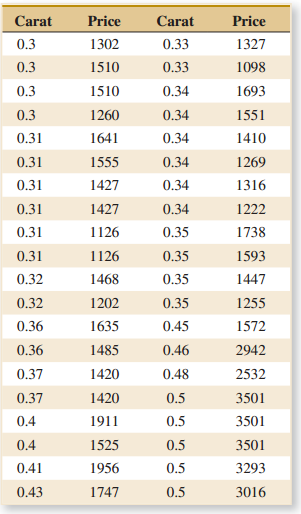
(a) Graph the data. What is the relation between carat and price? Is there an outlier?
(b) What would you say to the person who purchased the diamond that was an outlier?
(c) Fit two regression models, one with all the data and the other with unusual data omitted. Estimate the slope coefficient with a 95% confidence interval in both cases. Comment on any difference.
Fantastic news! We've Found the answer you've been seeking!
Step by Step Answer:
a The relationship between carat and price is not lin...View the full answer

Answered By
Ehsan Mahmood
I’ve earned Masters Degree in Business Studies and specialized in Accounts & Finance. Couple with this, I have earned BS Sociology from renowned institute of Pakistan. Moreover, I have humongous teaching experience at Graduate and Post-graduate level to Business and humanities students along with more than 7 years of teaching experience to my foreign students Online. I’m also professional writer and write for numerous academic journals pertaining to educational institutes periodically.
248+ Reviews
287+ Question Solved
Related Book For 

Applied Statistics And Probability For Engineers
ISBN: 9781118539712
6th Edition
Authors: Douglas C. Montgomery, George C. Runger
Question Posted:
