

Question: Table E12-3 provides the highway gasoline mileage test results for 2005 model year vehicles from DaimlerChrysler. The full table of data (available on the books
Table E12-3 provides the highway gasoline mileage test results for 2005 model year vehicles from DaimlerChrysler. The full table of data (available on the book€™s Web site) contains the same data for 2005 models from over 250 vehicles from many manufacturers (Environmental Protection Agency Web site www.epa.gov/ otaq/cert/mpg/testcars/database).
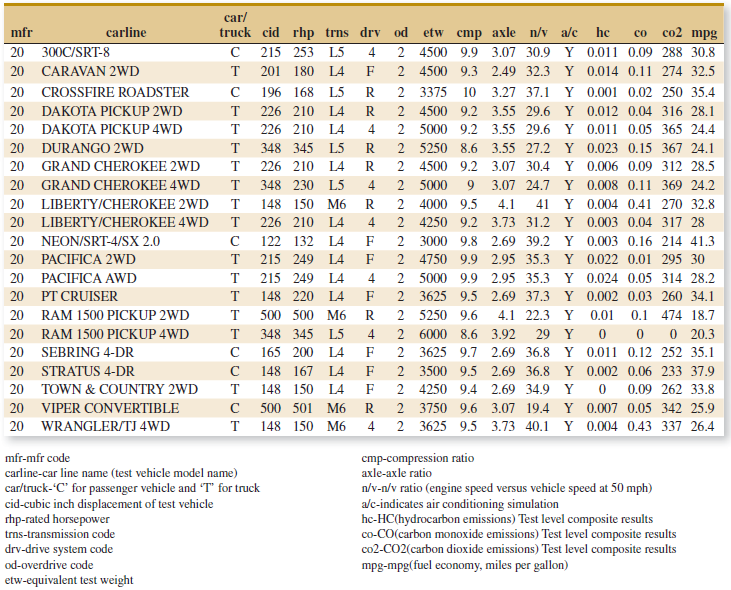
(a) Fit a multiple linear regression model to these data to estimate gasoline mileage that uses the following regressors: cid, rhp, etw, cmp, axle, n/v
(b) Estimate σ2 and the standard errors of the regression coefficients.
(c) Predict the gasoline mileage for the first vehicle in the table.
car/ truck cid rhp trns drv od co2 mpg mfr carline he etw cmp axle n/v a/c co 20 300C/SRT-8 C 215 253 L5 2 4500 9.9 3.07 30.9 Y 0.011 0.09 288 30.8 20 CARAVAN 2WD T 201 180 LA 2 4500 9.3 2.49 32.3 Y 0.014 0.11 274 32.5 20 CROSSFIRE ROADSTER 196 168 L5 R. 2 3375 10 3.27 37.1 Y 0.001 0.02 250 35.4 20 DAKOTA PICKUP 2WD 226 210 L4 R. 2 4500 9.2 3.55 29.6 Y 0.012 0.04 316 28.1 20 DAKOTA PICKUP 4WD 226 210 L4 4 2 5000 9.2 3.55 29.6 Y 0.011 0.05 365 24.4 348 345 L5 20 DURANGO 2WD R. 2 5250 8.6 3.55 27.2 Y 0.023 0.15 367 24.1 20 GRAND CHEROKEE 2WD 226 210 L4 R. 2 4500 9.2 3.07 30.4 Y 0.006 0.09 312 28.5 20 GRAND CHEROKEE 4WD 348 230 L5 4. 2 5000 9 3.07 24.7 Y 0.008 0.11 369 24.2 148 150 M6 4.1 20 LIBERTY/CHEROKEE 2WD 2 4000 9.5 41 Y 0.004 0.41 270 32.8 20 LIBERTY/CHEROKEE 4WD 226 210 L4 2 4250 9.2 3.73 31.2 Y 0.003 0.04 317 28 20 NEON/SRT-4/SX 2.0 122 132 L4 2 3000 9.8 2.69 39.2 Y 0.003 0.16 214 41.3 20 PACIFICA 2WD T 215 249 L4 2 4750 9.9 2.95 35.3 Y 0.022 0.01 295 30 20 PACIFICA AWD 215 249 LA 4 2 5000 9.9 2.95 35.3 Y 0.024 0.05 314 28.2 20 PT CRUISER 148 220 L4 2 3625 9.5 2.69 37.3 Y 0.002 0.03 260 34.1 0.1 474 18.7 0 20.3 20 RAM 1500 PICKUP 2WD 500 500 M6 R. 2 5250 9.6 4.1 22.3 Y 0.01 20 RAM 1500 PICKUP 4WD 348 345 L5 4 6000 8.6 3.92 29 Y 20 SEBRING 4-DR 165 200 L4 2 3625 9.7 2.69 36.8 Y 0.011 0.12 252 35.1 20 STRATUS 4-DR 148 167 LA 2 3500 9.5 2.69 36.8 Y 0.002 0.06 233 37.9 20 TOWN & COUNTRY 2WD 148 150 L4 2 4250 9.4 2.69 34.9 Y 0.09 262 33.8 20 VIPER CONVERTIBLE 500 501 M6 R. 2 3750 9.6 3.07 19.4 Y 0.007 0.05 342 25.9 20 WRANGLER/TJ 4WD 148 150 M6 4 2 3625 9.5 3.73 40.1 Y 0.004 0.43 337 26.4 cmp-compression ratio axle-axle ratio mfr-mfr code carline-car line name (test vehicle model name) car/truck-"C" for passenger vehicle and "T" for truck cid-cubic inch displacement of test vehicle rhp-rated horsepower tms-transmission code drv-drive system code od-overdrive code n/v-n/v ratio (engine speed versus vehicle speed at 50 mph) alc-indicates air conditioning simulation he-HC(hydrocarbon emissions) Test level composite results co-CO(carbon monoxide emissions) Test level composite results co2-CO2(carbon dioxide emissions) Test level composite results mpg-mpg(fuel economy, miles per gallon) etw-equivalent test weight
Step by Step Solution
3.48 Rating (178 Votes )
There are 3 Steps involved in it
a b c The regression equation is mpg 499 00104 cid 00012 rhp 000324 etw029 cmp 0190 nv Predi... View full answer

Get step-by-step solutions from verified subject matter experts