

Question: Although you should not expect a perfectly fitting model for any time-series data, you can consider the first differences, second differences, and percentage differences for
Although you should not expect a perfectly fitting model for any time-series data, you can consider the first differences, second differences, and percentage differences for a given series as guides in choosing an appropriate model.
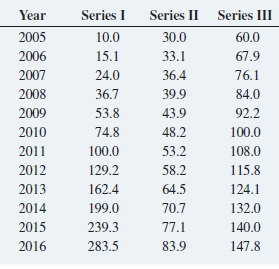
For this problem, use each of the time series presented in the table above and stored in TSModel1:
a. Determine the most appropriate model.
b. Compute the forecasting equation.
c. Forecast the value for 2017.
Series I Year Series II Series III 30.0 2005 10.0 60.0 2006 15.1 33.1 67.9 24.0 36.4 2007 76.1 84.0 2008 36.7 39.9 2009 53.8 43.9 92.2 48.2 2010 74.8 100.0 100.0 2011 53.2 108.0 2012 129.2 58.2 115.8 2013 64.5 162.4 124.1 70.7 2014 199.0 132.0 2015 77.1 239.3 140.0 283.5 2016 83.9 147.8
Step by Step Solution
3.45 Rating (161 Votes )
There are 3 Steps involved in it
a Time Series I For Time Series I second differences are the most stable with values staying near 4 ... View full answer

Get step-by-step solutions from verified subject matter experts