

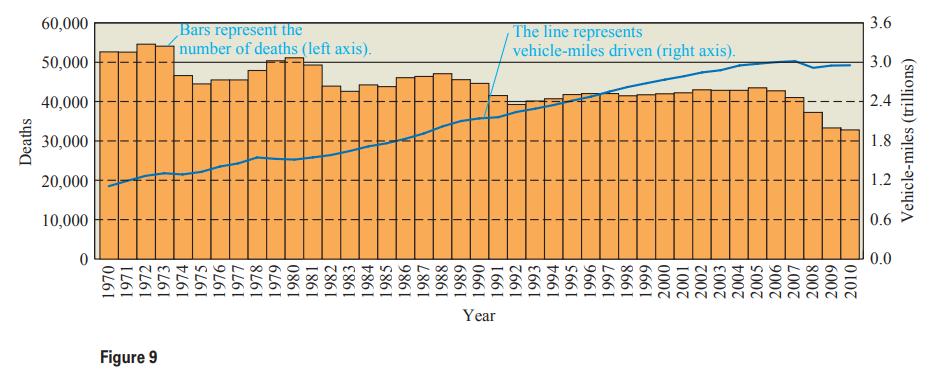
Figure 9 shows the number of automobile fatalities and the total number of miles driven (among all
Question:
Figure 9 shows the number of automobile fatalities and the total number of miles driven (among all Americans) for each year over a period of more than four decades. In terms of death rate per mile driven, how has the risk of driving changed?
Fantastic news! We've Found the answer you've been seeking!
Step by Step Answer:
We start by comparing the approximate death rates per mile for 1970 and 2010 Note that 52 108 dea...View the full answer

Answered By
Rohit Goyal
I have been tutoring online since last 4 years on various different platforms. Apart from online tutoring, I have been also taking home tuitions for various commerce and business subjects. I have completed my bachelors from prestigious institution BITS Pilani, Pilani campus and has been working since then. I have also been a teaching assistant in my college for various economic subjects and was always a go-to person for my peers and juniors for any kind of help in these subjects.
Regarding my style of teaching, I not only focus on theoretical concepts but also help my students in learning the application part as well. I try to break the problems into smaller bits and then tackle them to make it easier to understand. I commensurate with the level of student to explain the concept and help them get rid of all their problems.
My students always admire me for my simplicity and my rich knowledge in broader category of subjects. I always ensure that I don't let my students down and help them the best way.
0 Reviews
10+ Question Solved
Related Book For 
Statistical Reasoning For Everyday Life
ISBN: 9780321904645
4th International Edition
Authors: Jeffrey Bennett, William L. Briggs, Mario F. Triola
Question Posted:
