

Question: Using the data in Table 1, create a scatterplot to look for a correlation between a diamonds color and price. Comment on the correlation. TABLE
Using the data in Table 1, create a scatterplot to look for a correlation between a diamond’s color and price. Comment on the correlation.
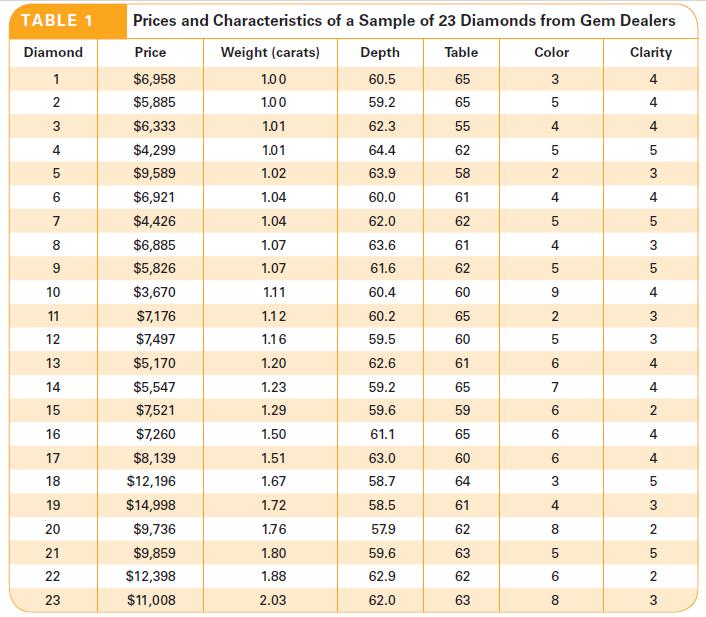
TABLE 1 Prices and Characteristics of a Sample of 23 Diamonds from Gem Dealers Diamond Price Weight (carats) Depth Table Color Clarity 1 $6,958 1.00 60.5 65 3 4 2 $5,885 1.00 59.2 65 5 4 3 $6,333 1.01 62.3 55 4 $4,299 1.01 64.4 62 5 $9,589 1.02 63.9 58 6 $6,921 1.04 60.0 7 $4,426 1.04 62.0 62 8 $6,885 1.07 63.6 61 6 $5,826 1.07 61.6 10 $3,670 1.11 60.4 11 $7,176 1.12 60.2 12 $7,497 1.16 59.5 13 $5,170 1.20 62.6 61 14 $5,547 1.23 59.2 15 $7,521 1.29 59.6 16 $7,260 1.50 61.1 17 $8,139 1.51 63.0 18 $12,196 1.67 58.7 19 $14,998 1.72 58.5 20 $9,736 1.76 57.9 222 21 $9,859 1.80 59.6 22 $12,398 1.88 62.9 23 $11,008 2.03 62.0 83 3 3 2 2 2 2 2 22 3 2 3 2 8 G 4 4 5 5 2 3 LO 5 4 4 4 5 62 LO 60 9 5 4 . 35 65 2 3 60 10 5 3 6 4 65 7 4 59 6 2 65 6 co 4 60 6 4 64 3 5 61 4 3 62 8 2 63 LO 5 5 62 6 2 63 8 3
Step by Step Solution
3.49 Rating (149 Votes )
There are 3 Steps involved in it
We expect price to depend on color so we plot the explanatory variabl... View full answer

Get step-by-step solutions from verified subject matter experts