

Question: Explain how to show the graph of the relation y 2 = x on a graphing calculator, and then display it on the calculator. See
Explain how to show the graph of the relation y2 = x on a graphing calculator, and then display it on the calculator. See Example 8 on page 99.
Data from Example 8
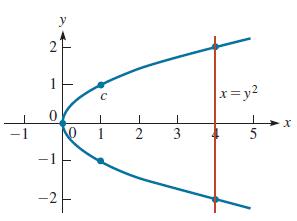
Use the vertical line test to determine whether the relation y2 = x represents a function. By letting x = 0, 1, and 4, we get the table and graph shown in Fig. 3.22.
Note that any positive value of x has two corresponding values of y. Since a vertical line crosses this graph twice, this relation is not a function.
Fig. 3.22.
-1 2 1 0 -1 -2 C 1 2 3 |x=y2 5 X
Step by Step Solution
3.38 Rating (176 Votes )
There are 3 Steps involved in it
To show the graph of the relation y2 x on a graphing calculator follow these ... View full answer

Get step-by-step solutions from verified subject matter experts