

Question: In Example 2, change the last constraint to 3y x 4. Then graph the feasible points and find the maximum and minimum values
In Example 2, change the last constraint to 3y − x ≤ 4. Then graph the feasible points and find the maximum and minimum values of F.
Data from Example 2
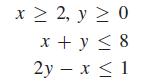
Find the maximum and minimum values of the objective function F = 3x + y, subject to the constraints
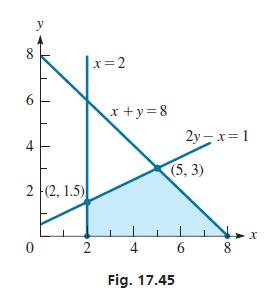
The constraints are graphed as shown in Fig. 17.45. We then locate the vertices, and evaluate F at these vertices as follows.
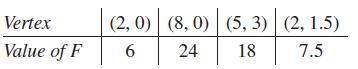
Therefore, we see that the maximum value of F is 24, and the minimum value of F is 6. If we check the value of F at any other feasible point, we will find a value between 6 and 24.
x 2, y 0 x + y 8 2y x 1 =
Step by Step Solution
3.37 Rating (150 Votes )
There are 3 Steps involved in it
To change the last constraint to 3y x 4 we need to modify the thi... View full answer

Get step-by-step solutions from verified subject matter experts