

Question: In Example 2, change the + sign before y 2 to . Data from Example 2 Plot the graph of the equation x 2 +
In Example 2, change the + sign before y2 to −.
Data from Example 2
Plot the graph of the equation x2 + y2 = 25. We first solve this equation for y, and we obtain
![]()
which we write as
![]()
We now assume values for x and find the corresponding values for y.
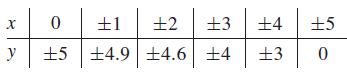
If x > 5, values of y are imaginary. We cannot plot these because x and y must both be real. When we show y = ±3 for x = ±4, this is a short way of representing four points. These points are (4, 3),(4, −3),(−4, 3), and (−4, −3).
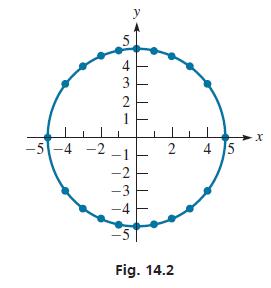
In Fig. 14.2, the resulting curve is a circle. A circle with its center at the origin results from an equation of the form x2 + y2 = r2, where r is the radius.
y = 25 x, or y = -25 - x, -
Step by Step Solution
3.35 Rating (161 Votes )
There are 3 Steps involved in it
If we change the sign before y 2 to Plotting the graph of the equation x 2 y ... View full answer

Get step-by-step solutions from verified subject matter experts