

Question: In Example 1, change the last constraint to 2x + y 8. Then graph the feasible points and find the maximum value of F.
In Example 1, change the last constraint to 2x + y ≤ 8. Then graph the feasible points and find the maximum value of F.
Data from Example 1
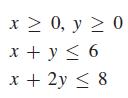
Find the maximum value of F, where F = 2x + 3y and x and y are subject to the conditions that
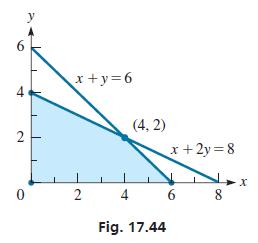
These four inequalities that define the conditions on x and y are known as the constraints of the problem, and F is known as the objective function. We now graph this set of inequalities, as shown in Fig. 17.44. Each point in the shaded region (including the line segments on the edges) satisfies all the constraints and is known as a feasible point.
The maximum value of F must be found at one of the feasible points. Testing for values at the vertices of the region, we have the values in the following table:
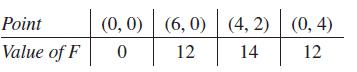
If we evaluate F at any other feasible point, we will find that F
x 0, y 0 x + y 6 x + 2y 8
Step by Step Solution
3.31 Rating (166 Votes )
There are 3 Steps involved in it
To graph the feasible region we first need to graph the ... View full answer

Get step-by-step solutions from verified subject matter experts