

Question: In Example 3, change the before the 2sin to +. Data from Example 3 Plot the graph of r = 1 2sin. Choosing
In Example 3, change the − before the 2sinθ to +.
Data from Example 3
Plot the graph of r = 1 − 2sinθ. Choosing values of θ and then finding the corresponding values of r, we find the following table of values.
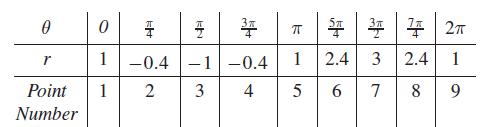
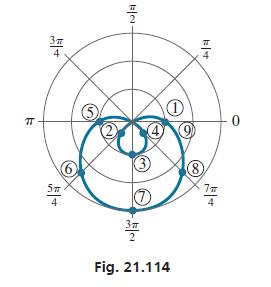
[Particular care should be taken in plotting the points for which r is negative. We recall that when r is negative, the point is on the side opposite the pole from which it is positive.] This curve is known as a limaçon and is shown in Fig. 21.114.
0 r Point Number EH 0 1 1 2 -0.4 3F -1 -0.4 3 4 EN st Sp 3 1 2.4 3 5 6 7 k T 4 2 2.4 1 8 9
Step by Step Solution
3.48 Rating (165 Votes )
There are 3 Steps involved in it
If we change the negative sign before 2sin to a positive s... View full answer

Get step-by-step solutions from verified subject matter experts