

Question: In Example 3, change the sign on the left side of the equation from to +. Data from Example 3 Using a calculator, graphically
In Example 3, change the sign on the left side of the equation from − to +.
Data from Example 3
Using a calculator, graphically solve the equation x2 − 2x = 1.
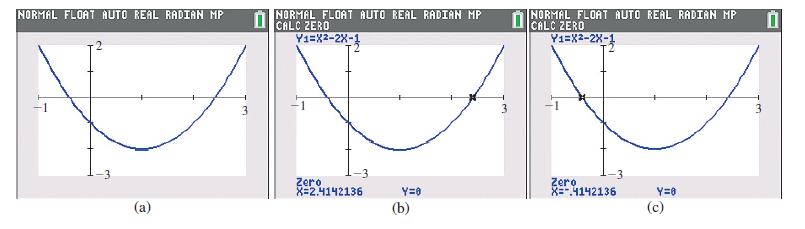
Following the above procedure, we first rewrite the equation as x2 − 2x − 1 = 0 and then set y = x2 − 2x − 1. Next, we graph this function as shown in Fig. 3.30(a).
Since the graph crosses the x-axis twice, the equation has two solutions which appear to
be approximately x ≈ −0.5 and x ≈ 2.5.
A graphing calculator can be used to find the x-intercepts with a high level of accuracy by using the zero feature. When using the zero feature, one must move the crosshairs on the calculator screen to choose a left bound (to the left of the x-intercept), a right bound (to the right of the x-intercept), and then a guess (near the x-intercept), pressing Enter after each entry. The calculator will then display the x-intercept. This process must be repeated twice, once for each x-intercept. The solutions, which are shown in Fig. 3.30(b) and (c), are x = −0.414 and x = 2.414 (rounded to the nearest thousandth). Note that these solutions are close to our original estimates.
Fig. 3.30
NORMAL FLOAT AUTO REAL RADIAN MP (a) 0 NORMAL FLOAT AUTO REAL RADIAN MP CALC ZERO Y1=X2-2X-1 Zero X=2.4142136 Y=0 (b) NORMAL FLOAT AUTO REAL RADIAN MP Y1=X-2X-1 CALC -3 Zero X=-.4142136 Y=0 (c)
Step by Step Solution
3.41 Rating (160 Votes )
There are 3 Steps involved in it
ANSWER To change the sign on the left side of the equa... View full answer

Get step-by-step solutions from verified subject matter experts