

Question: Perform the indicated operations if the given changes are made in the indicated examples of this section. In Example 7, change the logarithm base to
Perform the indicated operations if the given changes are made in the indicated examples of this section.
In Example 7, change the logarithm base to 4 and then plot the graph.
Data from Example 7
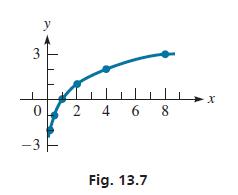
Plot the graph of y = log2 x.
We can find the points for this graph more easily if we first put the equation in exponential form: x = 2y. By assuming values for y, we can find the corresponding values for x.

Using these values, we construct the graph seen in Fig. 13.7.
X y -7 4 -2 2-2 1 0 2 4 1 2 2 = 4 8 3
Step by Step Solution
3.38 Rating (173 Votes )
There are 3 Steps involved in it
We are given y log 4 x and we need to plot the graph Let us ... View full answer

Get step-by-step solutions from verified subject matter experts