

Question: Represent the data graphically. An oil burner propels air that has been heated to 90C. The temperature then drops as the distance from the burner
Represent the data graphically.
An oil burner propels air that has been heated to 90°C. The temperature then drops as the distance from the burner increases, as shown in the following table:
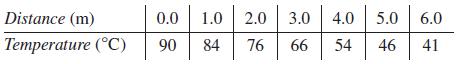
Distance (m) Temperature (C) 0.0 1.0 2.0 3.0 90 84 76 66 4.0 5.0 6.0 54 46 41
Step by Step Solution
★★★★★
3.41 Rating (151 Votes )
There are 3 Steps involved in it
1 Expert Approved Answer
Step: 1 Unlock

To represent the data graphically we can create a scatter plot ... View full answer
Question Has Been Solved by an Expert!
Get step-by-step solutions from verified subject matter experts
Step: 2 Unlock
Step: 3 Unlock