

Question: The given changes in the indicated examples, and then draw the graphs. In Example 2, change the 4 to 2 and then make the graph.
The given changes in the indicated examples, and then draw the graphs.
In Example 2, change the 4 to 2 and then make the graph.
Data from Example 2
Construct the graph of y = 4(3x) on semilogarithmic graph paper. This is the same function as in Example 1, and we repeat the table of values:
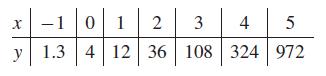
Again, we see that the range of y-values is large. When we plotted this curve on the rectangular coordinate system in Example 1, we had to use large units along the y-axis. This made the values of 1.3, 4, 12, and 36 appear at practically the same level. However, when we use semilog graph paper, we can label each axis such that all y-values are accurately plotted as well as the x-values.
The logarithmic scale is shown in cycles, and we must label the base line of the first cycle as 1 times a power of 10 (0.01, 0.1, 1, 10, 100, and so on) with the following cycle labeled with the next power of 10. The lines between are labeled with 2, 3, 4, and so on, times the proper power of 10. See the vertical scale in Fig. 13.23. We now plot the points in the table on the graph. The resulting graph is a straight line, as we see in Fig. 13.23. Taking logarithms of each side of the equation, we have
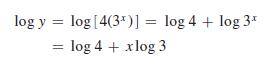
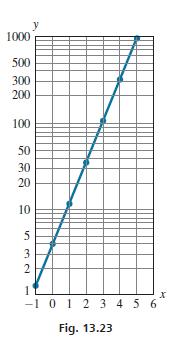
However, because log y was plotted automatically (because we used semilogarithmic paper), the graph really represents u = log 4 + x log 3 where u = log y; log 3 and log 4 are constants, and therefore this equation is of the form u = mx + b, which is a straight line (see Section 5.1). The logarithmic scale in Fig. 13.23 has three cycles, because all values of three powers of 10 are represented.
X y -10 1 2 34 5 1.3 4 12 36 108 324 972
Step by Step Solution
3.47 Rating (157 Votes )
There are 3 Steps involved in it
Construct the graph of y 23 x on semilogarithmic graph ... View full answer

Get step-by-step solutions from verified subject matter experts