

Question: Make the given changes in the indicated examples of this section and then plot the graphs. In Example 1, change the sign to +.
Make the given changes in the indicated examples of this section and then plot the graphs.
In Example 1, change the − sign to +.
Data from Example 1
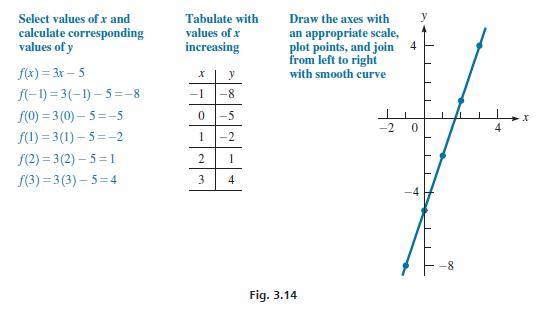
Graph the function f (x) = 3x − 5.For purposes of graphing, let y = f (x), or y = 3x − 5. Then, let x take on various values and determine the corresponding values of y. Note that once we choose a given value of x, we have no choice about the corresponding y-value, as it is determined by evaluating the function. If x = 0, we find that y = −5. This means that the point (0,−5) is on the graph of the function 3x − 5. Choosing another value of x, for example x = 1, we find that y = −2. This means that the point (1,−2) is on the graph of the function 3x − 5. Continuing to choose a few other values of x, we tabulate the results, as shown in Fig. 3.14. It is best to arrange the table so that the values of x increase; then there is no doubt how they are to be connected, for they are then connected in the order shown.
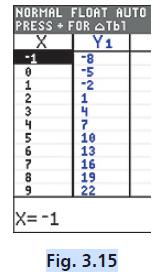
A graphing calculator can be used to quickly construct a table of ordered pairs by using its table feature (see Fig. 3.15).
By plotting and connecting these points, we see that the graph of the function 3x − 5 is a straight line.
Select values of x and calculate corresponding values of y f(x)= 3x - 5 f(-1)=3(-1)-5=-8 f(0)=3(0)-5--5 f(1) 3(1)-5--2 f(2)=3(2)-5=1 f(3) =3(3)-5=4 Tabulate with values of x increasing X y -8 0 -5 1 -2 -1 2 1 3 4 Draw the axes with an appropriate scale, plot points, and join from left to right with smooth curve Fig. 3.14 4 -2 0 -8 4 X
Step by Step Solution
3.45 Rating (148 Votes )
There are 3 Steps involved in it
We are given f x 3x 5 and we are required to plot the graph of this function When we con... View full answer

Get step-by-step solutions from verified subject matter experts