

Question: The data below come from a study that examines the efficacy of saliva cotinine as an Indicator for exposure to tobacco smoke. In one part
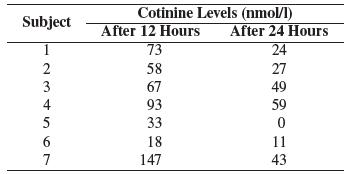
The data below come from a study that examines the efficacy of saliva cotinine as an Indicator for exposure to tobacco smoke. In one part of the study, seven subjects - none of whom were heavy smokers and all of whom had abstained from smoking for at least one week prior to the study-were each required to smoke a single cigarette. Samples of saliva were taken from all individuals 2, 12, 24, and 48 hours after smoking the cigarette. The cotinine levels at 12 hours and at 24 hours are provided below [210]. Assume that cotinine levels are approximately normally distributed.
Let #12 represent the population mean cotinine level 12 hours after smoking the cigarette and 24 the mean cotinine level 24 hours after smoking. It is believed that if 24 is not equal to 12.
It must be lower.
(a) Construct a one-sided 95% confidence interval for the true difference in population means #12-24. What does this tell you?
(b) Test the null hypothesis that the population means are identical at the a = 0.
05 level of significance. Use a one-sided test. What do you conclude?
Cotinine Levels (nmol/l) Subject After 12 Hours After 24 Hours 1 73 24 2345 58 27 67 49 93 59 33 0 6 18 11 7 147 43
Step by Step Solution
There are 3 Steps involved in it

Get step-by-step solutions from verified subject matter experts