

Question: 4. The data shown in Table 11-3 are from an experiment investigating the compressive strength of two different mixtures at two temperatures and two aging
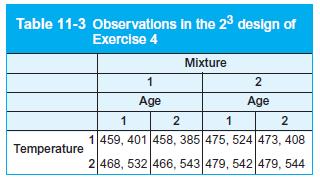
4. The data shown in Table 11-3 are from an experiment investigating the compressive strength of two different mixtures at two temperatures and two aging periods.
(a) Compute a table of signs for estimating the main and interaction effects, similar to Table 11-2. (Include the first column of treatment codes.)
(b) Use the table of signs constructed in part
(a) to estimate the main effects and interactions.
(c) Compute the sum of squares for each effect.
(d) You are given that MSE = 2096.1. Test for the significance of the main and interaction effects at level 0.05.
Table 11-3 Observations in the 23 design of Exercise 4 Temperature Mixture 1 2 Age Age 1 2 1 2 1459, 401 458, 385 475, 524 473, 408 2 468, 532 466, 543 479, 542 479, 544
Step by Step Solution
There are 3 Steps involved in it

Get step-by-step solutions from verified subject matter experts