

Question: Travel time Th e dotplot on the facing page displays data on students responses to the question How long does it usually take you to
Travel time Th e dotplot on the facing page displays data on students’ responses to the question “How long does it usually take you to travel to school?”
(a) Make a well-labeled histogram of the data.
(b) Describe the shape, center, and spread of the distribution. Are there any outliers?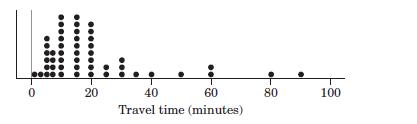
0 20 40 60 Travel time (minutes) -0 80 100
Step by Step Solution
There are 3 Steps involved in it
1 Expert Approved Answer
Step: 1 Unlock

Question Has Been Solved by an Expert!
Get step-by-step solutions from verified subject matter experts
Step: 2 Unlock
Step: 3 Unlock