

Question: The dotplot displays data on students responses to the question How long does it usually take you to travel to school? Describe the distribution. We
The dotplot displays data on students’ responses to the question “How long does it usually take you to travel to school?” Describe the distribution.
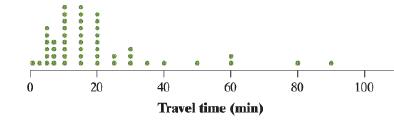
We used Census At School’s Random Data Selector to choose a sample of 50 Canadian students who completed a survey in a recent year.
:.. 20 40 60 80 100 Travel time (min)
Step by Step Solution
★★★★★
3.37 Rating (163 Votes )
There are 3 Steps involved in it
1 Expert Approved Answer
Step: 1 Unlock

The dotplot displays a skewed distribution with most of ... View full answer
Question Has Been Solved by an Expert!
Get step-by-step solutions from verified subject matter experts
Step: 2 Unlock
Step: 3 Unlock