

Question: Does the normal probability plot given in Figure 9.14, which resulted from fitting the model ???? = ????0 + ????1????1 + ????2????2 + ????, support
Does the normal probability plot given in Figure 9.14, which resulted from fitting the model ???? = ????0 + ????1????1 + ????2????2 + ????, support the normality assumption? Explain.
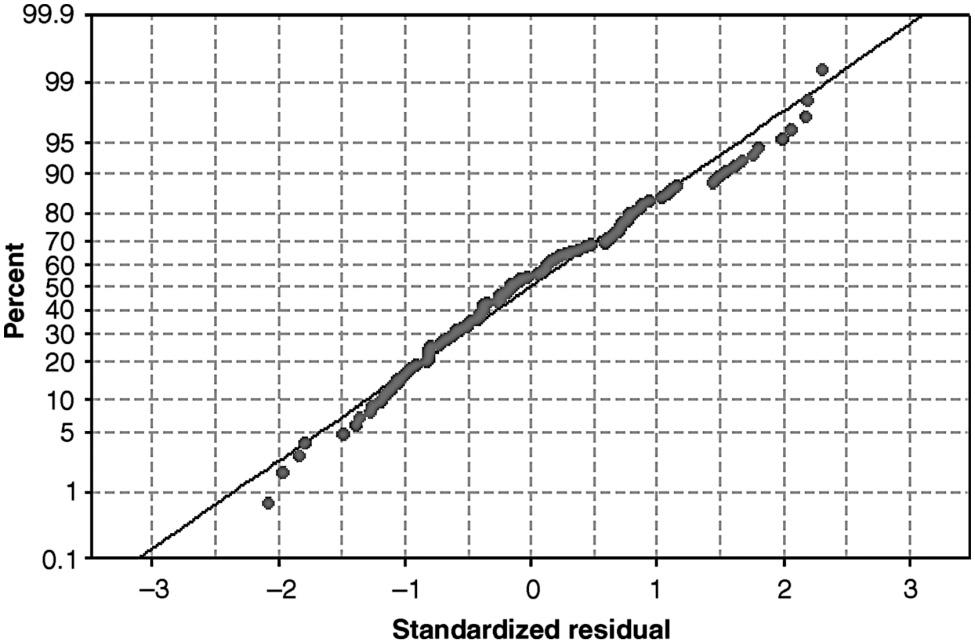
99.9 99 95 90 80 70 60 50 40 20 10 5 RODDONOS P 30 1 0.1 0 1 2 3 Standardized residual -2 -1
Step by Step Solution
There are 3 Steps involved in it
1 Expert Approved Answer
Step: 1 Unlock

Question Has Been Solved by an Expert!
Get step-by-step solutions from verified subject matter experts
Step: 2 Unlock
Step: 3 Unlock