

Question: Examine the data visualization below. Is it a histogram or a bar chart? How can you? Total Sales 2,000,000 1,500,000 1,000,000 500,000 North Total Sales
Examine the data visualization below. Is it a histogram or a bar chart? How can you?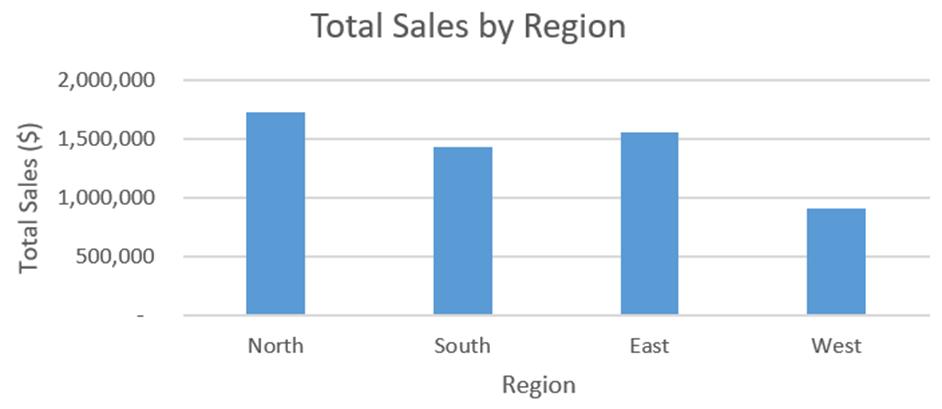
Total Sales 2,000,000 1,500,000 1,000,000 500,000 North Total Sales by Region South Region East West
Step by Step Solution
★★★★★
3.35 Rating (155 Votes )
There are 3 Steps involved in it
1 Expert Approved Answer
Step: 1 Unlock

It is a bar chart because the bars have spaces between t... View full answer
Question Has Been Solved by an Expert!
Get step-by-step solutions from verified subject matter experts
Step: 2 Unlock
Step: 3 Unlock