

Question: For the stockbroker model you developed in Problem 22, use a one-way data table to show how the brokers commission is a function of the
For the stockbroker model you developed in Problem 22, use a one-way data table to show how the broker’s commission is a function of the number of calls made.
Data from Problem 22
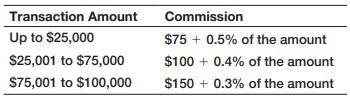
A stockbroker calls on potential clients from referrals. For each call, there is a 20% chance that the client will decide to invest with the stockbroker’s firm. Forty percent of those interested are found not to be qualified, based on the brokerage firm’s screening criteria. The remaining are qualified. Of these, half will invest an average of $5,000, 25% will invest an average of $20,000, 15% will invest an average of $50,000, and the remainder will invest $100,000. The commission schedule is as follows:
The broker keeps half the commission. Develop a spreadsheet to calculate the broker’s commission based on the number of calls per month made. What is the expected commission based on making 250 calls?
Transaction Amount Up to $25,000 $25,001 to $75,000 $75,001 to $100,000 Commission $75 + 0.5% of the amount $100+ 0.4% of the amount $150+ 0.3% of the amount
Step by Step Solution
3.41 Rating (160 Votes )
There are 3 Steps involved in it
Stockbroker Number of Calls 250 Commission Schedule Lower Limit Upper Limit Fixed ... View full answer

Get step-by-step solutions from verified subject matter experts