

Question: Lets analyze the transactions by customer. Create a pivot table in Excel showing how many invoices are associated with each customer. In addition, include a
Let’s analyze the transactions by customer. Create a pivot table in Excel showing how many invoices are associated with each customer. In addition, include a column showing the average gross profit margin percentage for each customer. Use the pivot table to answer the following questions:
a. How many customers purchased items in October?
b. Which customer had the highest number of sales transactions?
c. Which customer’s sales transactions had the highest average gross margin percentage?
d. How can management use the information in the pivot table?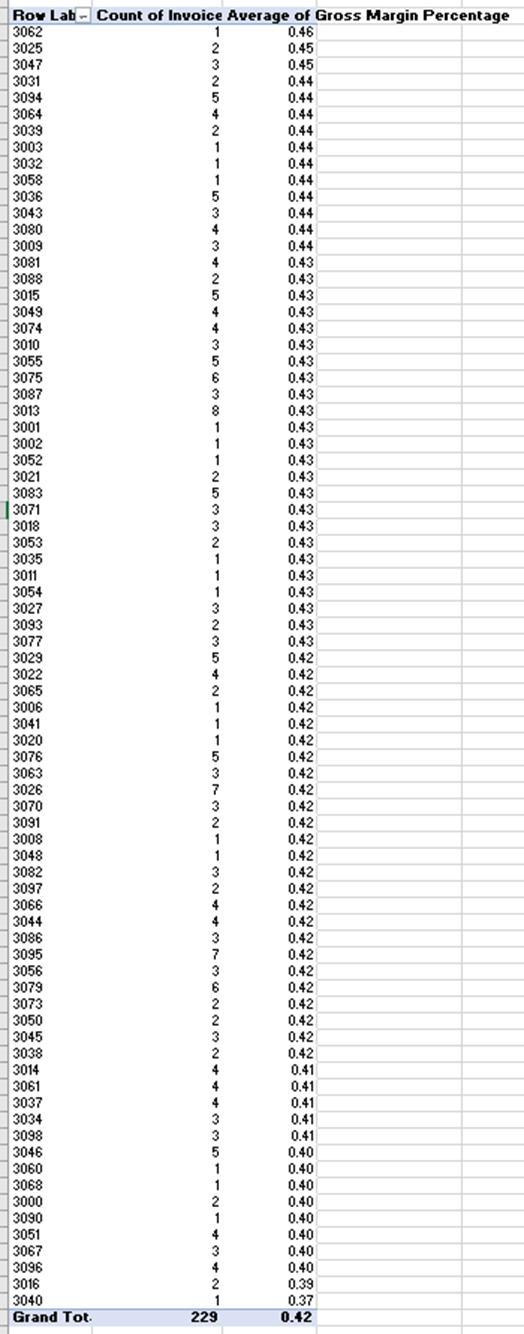
Row Lab Count of Invoice Average of Gross Margin Percentage 3062 0.46 3025 3047 3031 3094 3064 3039 3003 2002 3032 3058 3036 3043 3080 3009 3081 3088 3015 3049 3074 3010 3055 3075 3087 3013 3001 3002 3052 3021 3083 3071 3018 3053 3035 3011 3054 3027 3093 3077 3029 3022 3065 3006 3041 3020 3076 3063 3026 3070 3091 3008 3048 3082 3097 3066 3044 3086 3095 3056 3079 3073 3050 3045 3038 3014 3061 3037 3034 3098 3046 3060 3068 3000 3090 3051 3067 3096 3016 3040 Grand Tot. 1 2 3 2 5 4 2 1 1 5 3 4 3 4 2 5 4 3 5 6 3 1 1 2 5 3 3 2 1 1 1 3 2 3 5 4 2 1 1 1 5 3 7 3 2 1 3 2 4 4 3 7 3 6 2 2 3 2 4 4 4 3 3 5 1 1 2 4 3 4 2 1 229 0.45 0.45 0.44 0.44 044 0.44 04 0.44 X 0.44 20 0.44 0.44 0.44 0.44 0.44 0.44 0.43 0.43 0.43 0.43 0.43 0.43 0.43 0.43 0.43 0.43 0.43 0.43 0.43 0.43 0.43 0.43 042 0.43 042 0.43 0.43 0.43 0.43 0.43 0.43 0.43 0.42 0.42 0.42 0.42 0.42 0.42 0.42 0.42 0.42 0.42 0.42 0.42 0.42 0.42 0.42 0.42 0.42 0.42 0.42 0.42 0.42 0.42 0.42 0.42 0.42 0.42 0.41 0.41 0.41 0.41 0.41 0.40 0.40 0.40 0.40 0.40 0.40 0.40 0.40 0.39 0.37 0.42
Step by Step Solution
3.46 Rating (162 Votes )
There are 3 Steps involved in it
a 78 b Customer 3013 c Customer 3062 d Management can use the inform... View full answer

Get step-by-step solutions from verified subject matter experts