

Question: Use Excel charts to visualize the solution for the J&M Manufacturing problem (Example 15.8) using the Solver Sensitivity Report with auxiliary variables. Data from Example
Use Excel charts to visualize the solution for the J&M Manufacturing problem (Example 15.8) using the Solver Sensitivity Report with auxiliary variables.
Data from Example 15.8
Suppose that J&M Manufacturing makes four models of gas grills, A, B, C, and D. Each grill must flow through five departments: stamping, painting, assembly, inspection, and packaging. Table 15.1 shows the relevant data. In the second table, for instance, the stamping department can produce 40 units of model A each hour. (Grill A uses imported parts and does not require painting.) J&M wants to determine how many grills to make to maximize monthly profit.
To formulate this as a linear optimization model, let
A, B, C, and D = number of units of models A, B, C, and D to produce, respectively
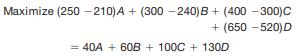
The objective function is to maximize the total net profit:
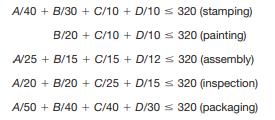
The constraints include limitations on the amount of production hours available in each department, the minimum sales requirements, and maximum sales potential limits. Here is an example of a situation where you must carefully look at the dimensions of the data. The production rates are given in units/hour, so if you multiply these values by the number of units produced, you will have an expression that makes no sense. Therefore, you must divide the decision variables by units per hour—or, equivalently, convert these data to hours/unit—and then multiply by the decision variables:
The sales constraints are simple upper and lower bounds on the variables:
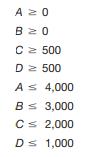
Nonnegativity constraints are implied by the lower bounds on the variables and, therefore, do not need to be explicitly stated.
Maximize (250-210) A+ (300-240) B + (400-300)C + (650 -520) D = 40A + 60B + 100C + 130D
Step by Step Solution
3.50 Rating (160 Votes )
There are 3 Steps involved in it
JM Manufacturing Data Grill model Selling price Variable cost Min Sales Max Sales A 25000 21000 0 40... View full answer

Get step-by-step solutions from verified subject matter experts